Клинический разбор в общей медицине №05 2026
1 Институт биохимии им. Г. Бунятяна НАН РА, Ереван, Армения;
2 Медицинский центр города Маралика, Маралик, Армения
lizasar2001@yahoo.com
Аннотация
Цель. Изучение потенциального значения изоферментов аденозиндезаминазы (ADA) в качестве диагностических маркеров при сахарном диабете 2-го типа (СД 2) и сопутствующих заболеваниях печени в популяции Армении. Целью также было установление пороговых значений активности изоферментов ADA у пациентов с СД 2 (с осложнениями со стороны печени и без них) и выявление корреляций с клиническими показателями крови.
Материалы и методы. В исследовании типа случай–контроль участвовали 175 пациентов и 105 здоровых лиц. Пациенты были сгруппированы по диагнозу и длительности заболевания (впервые выявленный СД 2, длительно текущий СД 2), а также по наличию осложнений со стороны печени (стеатоз или гепатит). Активность изоферментов ADA измерялась с использованием специфической колориметрической реакции. Статистический анализ применялся для сравнения активности изоферментов на разных стадиях заболевания, выявления корреляций с клиническими параметрами крови и определения оптимальных пороговых значений активности ADA2.
Результаты. Высокая активность ADA2 наблюдалась у пациентов с впервые выявленным СД 2 (21,3±2,99 Ед/л) и у пациентов с диабетом и стеатозом (23,46±2,73 Ед/л). В то же время активность ADA1 была особенно высокой у лиц с гепатитом (8,70±1,98 Ед/л) по сравнению с контрольной группой (3,19±0,20 Ед/л; p<0,001). Были установлены конкретные пороговые значения ADA2 для идентификации различных подгрупп пациентов. Обнаружена положительная корреляция между активностью ADA2 и процентным содержанием эозинофилов, что может свидетельствовать о связи с эозинофильным воспалением.
Заключение. Полученные результаты позволяют предположить, что изоферменты ADA1 и ADA2 могут представлять диагностическую ценность при СД 2 и его осложнениях. Особенно выделяется потенциал ADA2 для диагностики и стадирования СД 2, при этом различные пороговые значения могут использоваться для идентификации разных клинических подгрупп. ADA2 может служить маркером ранней стадии СД 2 и стеатоза, а ADA1 – маркером гепатита.
Ключевые слова: аденозиндезаминаза 1 и 2, плазма крови, стеатоз печени, гепатит, сахарный диабет 2-го типа.
Для цитирования: Саркисян Э.Ю., Гишян И.Б., Дарбинян М.М., Саркисова Е.Г. Распределение активности изоферментов аденозиндезаминазы у пациентов с сахарным диабетом 2-го типа и заболеваниями печени. Клинический разбор в общей медицине. 2026; 7 (5): 70–78. DOI: 10.47407/kr2026.7.5.00844
Introduction
Diabetes mellitus is a complex metabolic disease characterized by the dysregulation of glucose metabolism, resulting from either impaired insulin secretion (T1D) or decreased insulin sensitivity (T2D) [1, 2]. The majority of patients have T2D. Prolonged hyperglycemia is often accompanied by low-grade inflammation and immunological shifts involving both innate and adaptive immune cells, which can lead to damage in various organs and body systems [3, 4].
The liver is a major target organ for diabetic complications, second only to the pancreas. Nonalcoholic fatty liver disease (NAFLD), the most common liver disease globally, affects more than half of all individuals with T2D [5, 6].
Increasing evidence highlights the critical role of the adenosine system in regulating glucose homeostasis and in the pathophysiology of both T1D and T2D and their associated complications [7]. Adenosine, an endogenous purine nucleoside, modulates a wide range of physiological functions through various signaling pathways. It can influence many of the pathophysiological processes underlying T2D by affecting adipose tissue, skeletal muscle, and liver functions, as well as by regulating the immunological events that modulate insulin resistance [7, 8].
Intracellular adenosine levels are kept low by its phosphorylation to AMP via adenosine kinase and its deamination to inosine via adenosine deaminase (ADA; EC 3.5.4.4) [9].
In mammals, two genetically and functionally distinct ADA isoenzymes exist: ADA1 and ADA2. ADA1, encoded by a gene on chromosome 20q13.12, is a well-studied enzyme with high substrate affinity (Km ≈ 0.02 mM). It exists as a 35–41 kDa monomer or in a larger complex with ADA-binding protein (CD26/dipeptidyl peptidase IV). ADA2, encoded by the CECR1 gene on chromosome 22q11.21, is a less-characterized 110–120 kDa dimer with lower substrate affinity (Km ≈ 2.5 mM). Secreted primarily by monocytes and macrophages, ADA2 is a proposed biomarker for macrophage-driven inflammation. Both isoenzymes are widely expressed and serve as biomarkers for cell-mediated immunity in various immunological disorders [10–13].
However, extracellular adenosine levels in plasma can rise from nanomolar to micromolar concentrations at sites of inflammation, where energy demands increase and ADA-mediated deamination becomes a more dominant pathway [14].
In patients with T2D, a notable elevation in ADA activity has been observed in blood plasma compared to control groups. This activity has been shown to correlate with key markers of glycemic control, such as fasting blood glucose levels and glycated hemoglobin. Despite a significant number of studies on ADA in diabetes, its correlations with clinical blood parameters are highly complex and often contradictory. These inconsistencies depend on multiple factors, including specific study settings, patient demographics, and methodology [15, 16].
Our study presents novel data on ADA isoenzyme activity levels in T2D and its associated liver complications within the Armenian population of the highland region of Shirak (Armenia). The study was conducted in the Shirak highland region of Armenia (approximately 1500–2000 m above sea level). This region was specifically chosen because its population resides under moderate high-altitude conditions, providing an opportunity to explore how metabolic and genetic adaptations to altitude may influence biochemical and enzymatic markers, including adenosine deaminase isoenzymes.
We investigated the distribution of ADA isoenzyme activities in the plasma of patients with T2D, both with and without liver complications, and compared these findings to non-diabetic patients with liver disease and relatively healthy controls. We further examined how these activities vary based on the duration of diabetes and the stage of complications, and explored the correlations between ADA isoenzyme activities and various clinical blood parameters, including markers of inflammation and immune cell counts. We also considered the threshold values of ADA2 for different disease stages.
Materials and methods
Materials. Adenosine and erythro-9-(2-hydroxy-3-nonyl) adenine (EHNA) were obtained from Sigma-Aldrich (St. Louis, MO, USA). All other reagents were of analytical grade and high purity.
Participants. This study enrolled patients with T2D without complications, patients with T2D and concomitant hepatic disease (HD-T2D), patients with hepatic disease but without diabetes (HD), and relatively healthy individuals (Controls). All participants were recruited at the Maralik Medical Center between 2021 and 2024.
In total, 175 patients and 105 healthy individuals were included. Patients were divided into the following groups based on their diagnosis:
Group I: T2D without complications (n=100). This group was subdivided into: new-onset T2D (NO-T2D, n=20): patients newly diagnosed or treated for less than one year and long-term T2D (LT-T2D, n=80): patients treated for more than one year (average duration 3–10 years).
Group II: T2D with hepatic disease (HD-T2D, n=30). This group was subdivided into: Hepatic steatosis (HS-T2D, n=18) – the initial stage of NAFLD and Hepatitis (HP-T2D, n=12) – including chronic hepatitis.
Group III: Non-diabetic patients with hepatic disease (HD, n=45). This group included: Hepatic steatosis (HS, n=30) and Hepatitis (HP, n=15).
Group IV: Healthy controls (HC, n=105) matched for age and sex.
Exclusion criteria included diabetes with hypertension, renal or rheumatic diseases, hepatitis B or C infection, SARS-CoV-2 infection, and liver cirrhosis.
All patients had a confirmed clinical diagnosis according to the guidelines of the American Diabetes Association. Ethical approval for this study was obtained from the Independent Bioethics Committee for Scientific Research of Yerevan State Medical University after Mkhitar Heratsi, Yerevan, Republic of Armenia (ethical code: #N1-3/24). All participants provided written informed consent prior to enrolment.
Procedures. All clinical procedures were performed at the Maralik Medical Center. Participants were examined in the morning after an overnight fast, having abstained from caffeine, smoking, and strenuous exercise since the previous evening. Fasting venous blood samples were collected into tubes containing 3.2% sodium citrate as an anticoagulant. Plasma was prepared by centrifugation at 3400 × g for 10 min at room temperature, and the platelet-free plasma was immediately used for enzymatic assays.
Anthropometric and biochemical measurements. Routine biochemical parameters were determined in the clinical laboratory using standard methods: Fasting blood glucose (FBG) – glucose oxidase-peroxidase (GOD-POD) method; Total bilirubin (BIL) – diazosulfanilic acid (DSA) method; Cholesterol (CHOL) – colorimetric method; Urea (UREA) – urease method.
Complete blood count, liver function tests (ALT, AST, prothrombin time), and renal function tests (blood urea, plasma creatinine) were measured using an automated biochemical analyser (Hitachi 7600, Japan), according to the manufacturer’s instructions. Hepatic steatosis and hepatitis were assessed by instrumental methods (ultrasonography, FibroScan, etc.) and clinical/laboratory data (liver enzymes), following accepted clinical guidelines.
Determination of ADA Activity. Total adenosine deaminase (ADAt) activity in plasma was determined by measuring the ammonia produced during the enzymatic deamination of adenosine. The reaction mixture (0.5 mL) contained 0.04 M potassium phosphate buffer (pH 7.0), 6 mM adenosine, and 20 µL of the plasma sample. The mixture was incubated at 37°C for 40 minutes. The reaction was stopped by adding 1 mL each of phenol–nitroprusside and hypochlorite reagents [17]. Absorbance was measured at 630 nm against a blank containing all reagents except the substrate. Ammonia concentration was determined using ammonium sulfate as a standard. ADA activity was expressed in U/L (µmol NH₃ produced per liter of plasma per minute).
ADA2 activity was measured using the same procedure, with 0.04 mM EHNA (a selective ADA1 inhibitor) added to the reaction mixture. ADA1 activity was calculated by subtracting ADA2 activity from total ADA. All samples were analyzed in triplicate using Cary 60 spectrophotometer (Agilent, USA) and Spekol-211 (Carl Zeiss, Jena, Germany) instruments.
Statistical analysis. Data were analyzed using GraphPad Prism 8 (Version 8.0.2). Results are presented as mean ± standard error of the mean (S.E.M.). Group comparisons were performed using non-parametric tests, including the Mann–Whitney test for two-group comparisons and one-way ANOVA for multiple groups. Normality of data distribution was assessed using the Shapiro–Wilk test. When ANOVA results were significant, Tukey’s post-hoc test was applied.
Correlations between ADA isoenzyme activity and clinical parameters were assessed using Spearman’s (r) coefficients. Pearson coefficients were used only when data were normally distributed.
Receiver operating characteristic (ROC) curve analysis was performed to evaluate diagnostic sensitivity, specificity, and optimal cutoff values. A two-tailed p-value <0.05 was considered statistically significant.
Results
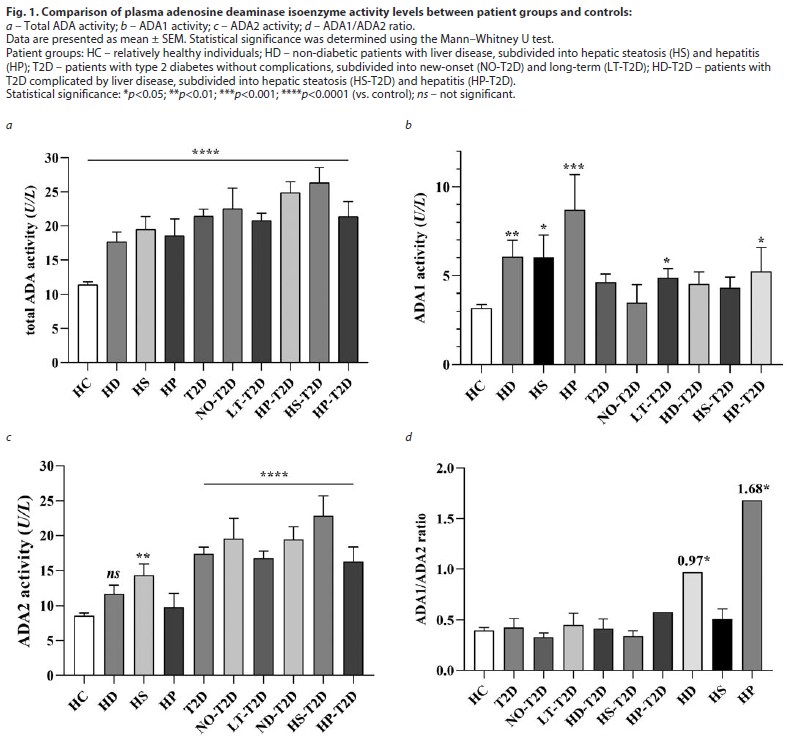
ADA activity in T2D patients. Our study demonstrated that the total activity of adenosine deaminase in the plasma of patients with T2D was significantly increased compared to the Controls (Fig. 1, a; p<0.0001). In patients with newly diagnosed T2D (NO-T2D), a marked elevation in ADA2 activity was observed (21.3±2.99 vs. 8.59±0.39 U/L), while ADA1 activity remained unchanged. In contrast, a slight increase in ADA1 activity was detected in patients with long-term T2D (LT-T2D). A similar pattern of ADA1 elevation was also noted in the HD-T2D group (Fig. 1, b).
The overall increase in total ADA activity was primarily attributed to the ADA2 isoenzyme, consistent with previous reports [14–16]. The highest ADA2 activity (23.46±2.73 vs. 8.59±0.39 U/L in Controls) was recorded in the HS-T2D subgroup (Fig. 1, c). The ADA1/ADA2 ratio varied depending on the stage of the disease (Fig. 1, d).
In the HD group, ADA1 isoenzyme activity was significantly higher (p<0.001) compared with HC, whereas ADA2 activity did not show a significant increase (Fig. 1, b, c). ADA2 activity tended to be slightly higher in HD-T2D patients than in those with T2D alone, although the difference did not reach statistical significance.
The figure clearly illustrates that ADA1 activity is notably elevated in hepatitis (both with and without diabetes), whereas ADA2 activity is markedly increased in diabetic patients — particularly in those with newly diagnosed diabetes and hepatic steatosis.
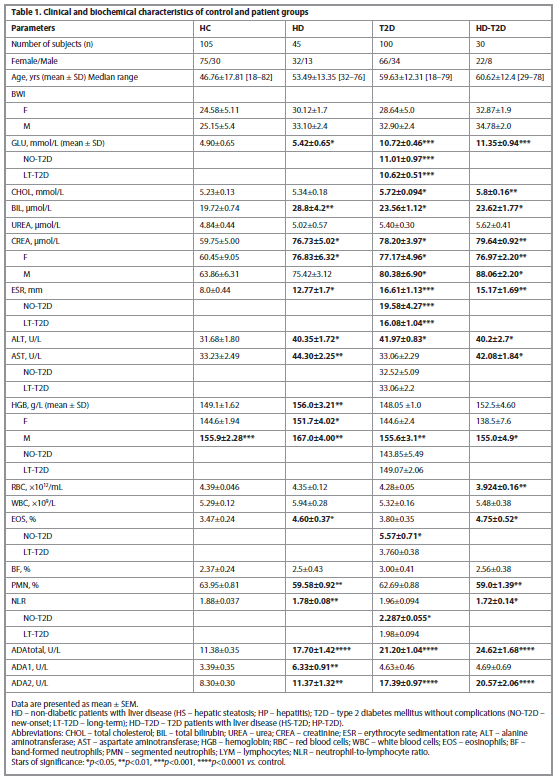
The clinical characteristics of all patient groups are summarized in Table 1.
A significant difference was observed between GLU, CHOL, CREA, HGB, ALT and ESR in patients with T2D compared to Controls. In HD-T2D patients, the difference in clinical characteristics was mainly comparable with the data of HD patients; the exception was CHOL, which increases in T2D and HD-T2D patients; RBC was lower compared to control only in HD-T2D patients (p=0.0074).
ADA isoenzyme correlations with clinical parameters. Table 2 presents correlations between the activity of ADA isoenzymes and a number of clinical parameters.
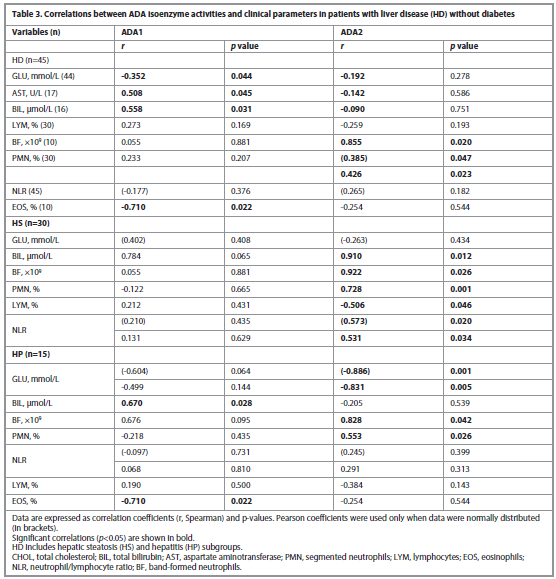
For comparison, correlations of ADA isoenzyme activities with clinical parameters were also performed for patients with liver diseases but without diabetes, and these are presented in Table 3.
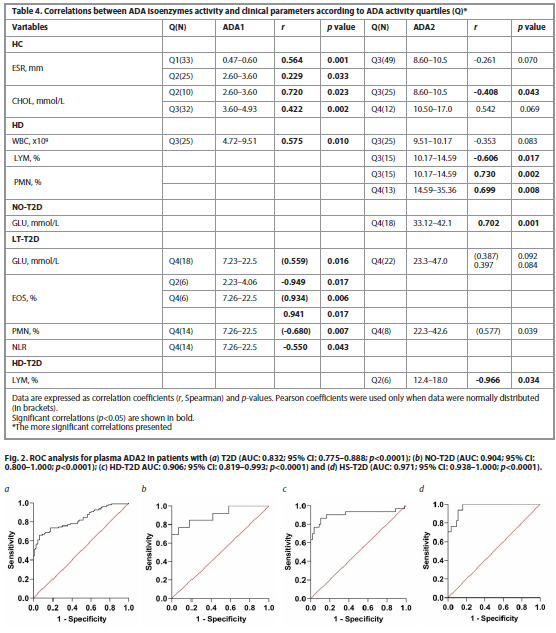
We next determined correlations by quartiles of ADA isoenzyme activity, which allowed us to identify significant values of ADA activity in more detail, Table 4.
In the Controls, ADA1 positively correlates with ESR at the lowest ADA1 level, Q1 (<2.6 U/L); with increasing ADA1 (Q2), this correlation weakened. The positive ADA1-CHOL correlation, on the contrary, increases starting from the Q2 (>2.6 U/L). At the onset of the disease, in NO-T2D, a positive ADA1 with LYM correlation remained, which was no longer observed in LT-T2D. In HD in Q3 (>4.7 U/L) with an increase in ADA1, an ADA1 with WBC correlation was detected. An inverse correlation of ADA2 with LYM and a positive correlation with PMN (BF) was observed starting from Q3 (ADA2>10 U/L), therefore ADA2>10 U/L can be considered critical, at which immune protection becomes evident. In NO-T2D the ADA2 and GLU strong positive correlation was revealed, the most in Q4 (>30 U/L). In LT-T2D, the correlation between the highest ADA1 isoenzyme and GLU was observed in Q4 (ADA1>6.19), Table 4.
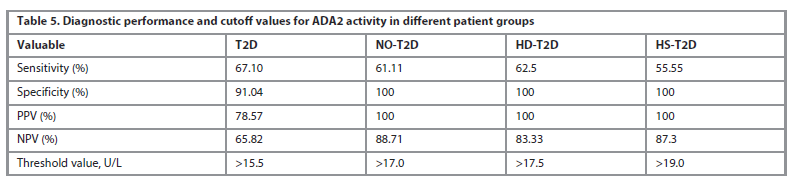
A ROC analysis was conducted on ADA2, given its more significant alterations in T2D and HD-T2D. The thresholds of ADA2 activity were determined, Fig. 2.
An optimal cutoff ADA2 activity values for different patient groups were calculated and presented in Table 5.
This table demonstrates the potential of ADA2 as a biomarker for diagnosing and staging T2D, with different cutoff values being useful for identifying different patient subgroups.
Discussion
Our study demonstrated that in T2D patients the total ADA activity was significantly elevated compared to HC. This increased activity was primarily due to the ADA2 isoenzyme, which is consistent with previous reports [15, 16]. However, in our patients, total ADA and isoenzyme activities were notably lower than most published values in both healthy controls and disease groups [16], although a comparable lower value has also been reported [19].
In patients with NO-T2D, the high level of ADA2 activity was observed, while ADA1 activity remained unchanged. In contrast, patients with LT-T2D and HD-T2D showed a moderate increase in ADA1 activity in addition to the elevated ADA2, Fig. 1, d.
In the comparison group of patients with HD, the activity of the ADA1 isoenzyme was significantly higher compared to control, particularly in HP group (8.70±1.98 vs 3.19±0.20 U/L, p<0.001), while no significant increase was found in ADA2 activity. However, a prevalence of ADA2 activity was found in the HS group, an earlier stage of the disease, compared to the HC (14.32±1.62 U/L vs 8.59±0.39 U/L, p<0.005), Table 3.
Correlations between ADA isoenzyme activity and various clinical blood parameters confirmed their involvement in homeostatic mechanisms [15, 16]. The most significant correlations were observed with CHOL, ESR, UREA, GLU, HGB, ALT, AST, AST/ALT ratio, BIL, LYM, BF, PMN, EOS, and NLR. Positive correlations were consistently noted with the isoenzyme that was dominant under specific conditions. In patients with NO-T2D, a strong positive correlation was found between ADA2 activity and GLU, particularly at higher ADA2 levels (Q4, >30 U/L). In contrast, in LT-T2D, ADA1 showed a positive correlation with glucose also in the highest quartile (Q4, >6.19 U/L), indicating a potential shift in the isoenzyme's role as the disease becomes chronic.
In HS-T2D patients, the positive correlation between ADA1 and glucose levels suggests that ADA1 may play a role in early-stage liver complications related to diabetes. This could be due to its involvement in the metabolic and inflammatory processes characteristic of these conditions. However, in patients with both T2D and hepatitis, these correlations were disrupted, likely due to the ongoing inflammation from the hepatitis complication. The acute inflammatory state of hepatitis can alter the activity of ADA isoenzymes and their relationship with other metabolic markers, overriding the more subtle, chronic correlations observed in HS-T2D. An increase in white blood cells, particularly an elevated neutrophil-to-lymphocyte ratio (NLR), is a key laboratory sign of inflammation [20]. Although the NLR values in this study were low, the highest was found in new-onset T2D patients (2.287±0.055), which is consistent with existing literature suggesting that elevated levels may indicate impaired glucose metabolism and serve as an additional marker for diabetes control [21].
Our results further support this, showing a positive correlation between ADA1 and lymphocytes, and between ADA2 and neutrophils across nearly all patient groups (Tables 2–4). This finding aligns with established mechanisms: human plasma ADA2 preferentially binds to neutrophils, while ADA1 binds to T and NK T cells that express CD26 receptors [20]. Because high levels of adenosine inhibit lymphocyte activation and proliferation [22], it was expected that increased ADA1 activity would positively correlate with the lymphocyte count, a finding that was confirmed in this study.
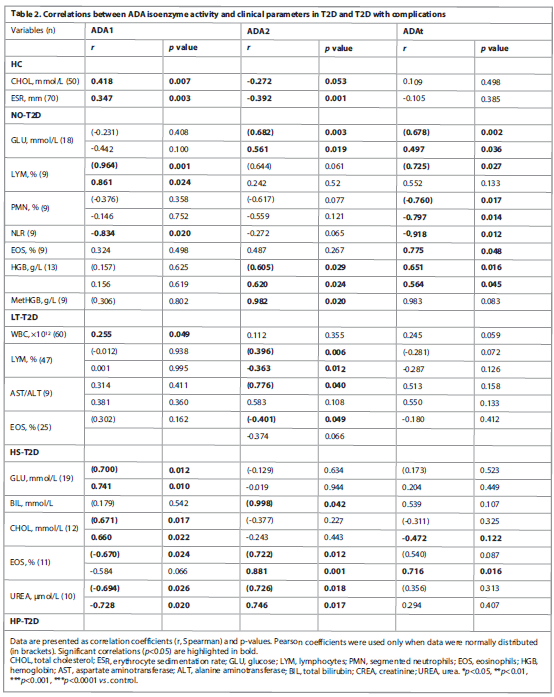
The observed increase in eosinophils is particularly interesting. In patients with hepatic disease with type 2 diabetes and diabetes alone, eosinophil levels were elevated, with the highest levels seen in newly diagnosed T2D patients (5.57% vs. 3.47% in controls, p=0.0135). In this group, we found a positive correlation between eosinophil count and ADA2 activity. In contrast, patients with long-term T2D showed only a small change in EOS levels, and an inverse correlation with ADA2. Similarly, in patients with T2D and steatosis, who also had high ADA2 activity, the association between ADA2 and EOS was positive, while ADA1 showed an inverse association with EOS. This finding suggests a complex, time-dependent relationship between ADA isoenzymes and eosinophils in T2D. The positive correlation in new-onset and steatosis-affected patients, alongside the inverse correlation in long-term T2D, highlights the dynamic role of these isoenzymes in different stages of the disease.
A study on the mechanism of ADA2's action on liver fibrosis in patients with NAFLD showed that monocytes infiltrating the liver produce high levels of ADA2, which then stimulates Kupffer cells to also express the enzyme. This positive association between serum ADA2 activity and liver fibrosis is believed to stem from a shift in macrophage polarization toward an anti-inflammatory, yet profibrotic, M2 phenotype [23, 24].
Interestingly, ADA2 deficiency (DADA2) has been shown to promote a pro-inflammatory macrophage differentiation in vitro. While the exact molecular mechanism of ADA2-induced M2 polarization and its impact on liver fibrosis is still being studied, it's clear that ADA2 plays a significant role in modulating immune cell behavior [10, 25].
Like ADA2, eosinophils also contribute to the resolution of inflammation. They secrete anti-inflammatory cytokines and are a major source of IL-4 in visceral adipose tissue, with their numbers inversely correlating with the degree of obesity. Eosinophils are also considered a factor in the polarization of monocytes into the anti-inflammatory M2 phenotype.
Although eosinophils and ADA2 are not part of the same biochemical pathway, they both function within the broader system of purinergic signaling to fine-tune immune responses. This shared role in promoting an M2 phenotype may explain the positive correlation observed between ADA2 and eosinophils in patients with diabetes and early-stage liver complications (HS-T2D), which exhibited the highest levels of ADA2.
Macrophage polarization is a key factor in inflammation and disease progression. An imbalance in their cytokine profiles can disrupt the delicate equilibrium of ADA isoenzymes [26].
Interestingly, in some late-stage tumors, a shift from the M2 to the M1 phenotype has been observed, a change accompanied by altered ADA isoenzyme activity. The ADA1/ADA2 ratio is therefore considered a valuable diagnostic tool, as it can indicate the severity and chronic nature of inflammation [27, 28]. This ratio reflects the complex interplay between different immune cell populations and their functional states.
The ADA1/ADA2 ratio varied significantly between patient subgroups, as shown in Fig. 1, c. For instance, in patients with both hepatitis and T2D, the ratio was significantly lower compared to those with hepatitis alone, despite an increase in ADA1 activity in both groups.
With uncontrolled inflammation, the conditions for a protective immune response are disrupted. In these cases, correlations between ADA isoenzymes and clinical parameters were attenuated or even undetectable. This suggests that the ADA1/ADA2 ratio may be a useful indicator of macrophage polarization and the overall inflammatory state.
The ROC analysis for plasma ADA2 in patients with hepatic disease and T2D, particularly in those with hepatic steatosis and T2D, showed a very high diagnostic value. The highest AUC (Area Under the Curve) value of 0.971 (95% CI: 0.938–1.000; p<0.0001) was observed in this subgroup, with a corresponding ADA2 activity threshold of 19.0 U/L. This high AUC indicates an excellent ability of ADA2 to distinguish between patients in this subgroup and healthy individuals.
Conclusion
We have conducted a comprehensive analysis of the activity of adenosine deaminase isoenzymes (ADA1 and ADA2) in various patient subgroups, which allows us to more accurately interpret their role.
This study suggests that ADA isoenzymes could be valuable diagnostic, prognostic, and therapeutic tools for type 2 diabetes and its liver complications.
ADA2 shows promise as a specific biomarker for the inflammatory component of T2D, particularly in its early stages. This is supported by its strong positive correlation with glucose and a high diagnostic value (a threshold of 19.0 U/L) for patients with T2D and hepatic steatosis. In contrast, ADA1 appears to be a better indicator of liver-related complications, correlating strongly with markers of liver damage and inflammation.
The distinct correlations of ADA1 with lymphocytes and ADA2 with neutrophils suggest that these isoenzymes play different roles in immune regulation. The study also proposes a link between ADA2 and eosinophils, suggesting they may collaboratively shift macrophage polarization toward an anti-inflammatory M2 phenotype. This sheds light on the complex interplay between metabolic disease, inflammation, and immune cell function.
The observed changes in ADA isoenzyme activity suggest that these molecules could be valuable therapeutic targets for managing T2D and its liver-related complications. Modulating the activity of these isoenzymes might influence inflammatory processes and improve patient outcomes.
Одобрение этического комитета. Диагноз «сахарный диабет 2-го типа» поставлен в соответствии с рекомендациями Американской ассоциации диабетологов. Все эксперименты, проведенные в ходе настоящего исследования, одобрены независимым комитетом по биоэтике Ереванского государственного медицинского университета им. Мхитара Гераци, Ереван, Республика Армения (протокол: #N1-3/24).
Ethical approval. Diagnosis of T2D was made according to the guidelines of the American Diabetes Association. All the experimental procedures in this study were approved by the Independent Bioethics Committee for Scientific Research of Yerevan State Medical University after Mkhitar Heratsi, Yerevan, Republic of Armenia, (ethical code: #N1-3/24).
Согласие на участие. Перед включением в исследование от всех участников получено письменное информированное согласие – в соответствии с принципами надлежащей клинической практики (GCP) и Хельсинкской декларации Всемирной медицинской ассоциации (принципами проведения медицинских исследований с участием человека).
Consent to participate. Written informed consent was obtained from all participants prior to their inclusion in the investigation, in accordance with Good Clinical Practice (GCP) standards and the WMA Declaration of Helsinki – Ethical Principles for Medical Research Involving Human Subjects.
Согласие на публикацию. Все авторы проверили результаты и одобрили финальную версию рукописи.
Competing interests. The authors declare that they have no competing interests.
Финансирование. Исследование выполнено без дополнительного финансирования.
Funding source. This research was not supported by any external funding.
Конфликт интересов. Авторы заявляют об отсутствии конфликта интересов.
Conflict of interests. The authors declare that there is no conflict of interests.
Список литературы доступен на сайте журнала https://klin-razbor.ru/
The list of references is available on the journal‘s website https://klin-razbor.ru/
Информация об авторах
Information about the authors
Elmira Yu. Sargsyan – Cand. Sci. (Biol.), Res. Officer, Buniatian Institute of Biochemistry of NAS RA. E-mail: el.sarkisyan@mail.ru; el.sarkisyan@yahoo.com
Саркисян Эльмира Юриковна – канд. биол. наук, науч. сотр. лаб. метаболизма адениловых соединений Института биохимии им. Г. Бунятяна НАН РА. E-mail: el.sarkisyan@mail.ru;
el.sarkisyan@yahoo.com
Inesa B. Gishyan – Assistant, Buniatian Institute of Biochemistry of NAS RA.
E-mail: inesagishyan@mail.ru; inesagishyan783@gmail.com
Гишян Инеса Багратовна – ассистент лаб. метаболизма адениловых соединений Института биохимии им. Г. Бунятяна НАН РА. E-mail: inesagishyan@mail.ru; inesagishyan783@gmail.com
Meri M. Darbinyan – doctor – laboratory assistant, Head of Laboratory of Clinical Biochemistry, Maralik Medical Center. E-mail: darbinyanmeri82@gmail.com
Дарбинян Мери Микаэловна – врач-лаборант, зав. лаб. клинической биохимии Медицинского центра Маралика. E-mail: darbinyanmeri82@gmail.com
Yelizaveta G. Sargisova – Cand. Sci. (Biol.), Senior Res. Officer, Buniatian Institute of Biochemistry of NAS RA. E-mail: lizasar2001@yahoo.com; ORCID: 0000-0002-1730-5340
Саркисова Елизавета Григорьевна – канд. биол. наук, ст. науч. сотр. лаб. метаболизма адениловых соединений Института биохимии им. Г. Бунятяна НАН РА. E-mail: lizasar2001@yahoo.com; ORCID: 0000-0002-1730-5340
Received: 10.10.2025
Revised: 30.10.2025
Accepted: 06.11.2025
Поступила в редакцию: 10.10.2025
Поступила после рецензирования: 30.10.2025
Принята к публикации: 06.11.2025
Клинический разбор в общей медицине №05 2026
Distribution of adenosine deaminase isoenzyme activities in patients with type 2 diabetes and liver complications
Номера страниц в выпуске:70-78
Abstract
Aim. This study investigated the potential of adenosine deaminase (ADA) isoenzymes as diagnostic markers for Type 2 Diabetes (T2D) and associated liver diseases in the population of Armenia. The aim of the study was to establish cutoff values for ADA isoenzyme activity in patients with T2D (with and without liver complications) and to study correlations with clinical blood parameters.
Materials and methods. The case-control study examined 175 patients and 105 healthy individuals; patients were grouped by diagnosis and disease duration (newly diagnosed T2D, long-term T2D) and the presence of liver complications (steatosis or hepatitis). ADA isoenzyme activity was measured in a specific colorimetric reaction. Statistical analysis was used to compare isoenzyme activity across different disease stages, determine correlations with clinical blood parameters, and calculate optimal cutoff values for ADA2 activity.
Results. The high ADA2 activity was found in newly diagnosed T2D patients (21.3±2.99 U/L) and in patients with diabetes with steatosis (23.46±2.73 U/L). In contrast, ADA1 activity was particularly high in individuals with hepatitis (8.70±1.98 U/L) compared to controls (3.19±0.20 U/L; p < 0.001). We established specific ADA2 cutoff values for identifying different patient subgroups. A positive correlation was found between ADA2 activity and the percentage of eosinophils, indicating an association with eosinophilic inflammation.
Conclusion. Our results suggest that ADA1 and ADA2 isoenzymes may be valuable diagnostic tools in T2D and its complications. In particular, the potential of ADA2 for diagnosing and staging T2D, with different cutoff values being useful for identifying different patient subgroups. ADA2 may be a marker of early T2D and steatosis, and ADA1 may be a marker of hepatitis.
Keywords: adenosine deaminase 1 and 2, blood plasma, hepatic steatosis, hepatitis, type 2 diabetes.
For citation: Sargsyan E.Yu., Gishyan I.B., Darbinyan M.M., Sargisova Ye.G. Distribution of adenosine deaminase isoenzyme activities in patients with type 2 diabetes and liver complications. Clinical review for general practice. 2026; 7 (5): 70–78 (In Russ.). DOI: 10.47407/kr2026.7.5.00844
Aim. This study investigated the potential of adenosine deaminase (ADA) isoenzymes as diagnostic markers for Type 2 Diabetes (T2D) and associated liver diseases in the population of Armenia. The aim of the study was to establish cutoff values for ADA isoenzyme activity in patients with T2D (with and without liver complications) and to study correlations with clinical blood parameters.
Materials and methods. The case-control study examined 175 patients and 105 healthy individuals; patients were grouped by diagnosis and disease duration (newly diagnosed T2D, long-term T2D) and the presence of liver complications (steatosis or hepatitis). ADA isoenzyme activity was measured in a specific colorimetric reaction. Statistical analysis was used to compare isoenzyme activity across different disease stages, determine correlations with clinical blood parameters, and calculate optimal cutoff values for ADA2 activity.
Results. The high ADA2 activity was found in newly diagnosed T2D patients (21.3±2.99 U/L) and in patients with diabetes with steatosis (23.46±2.73 U/L). In contrast, ADA1 activity was particularly high in individuals with hepatitis (8.70±1.98 U/L) compared to controls (3.19±0.20 U/L; p < 0.001). We established specific ADA2 cutoff values for identifying different patient subgroups. A positive correlation was found between ADA2 activity and the percentage of eosinophils, indicating an association with eosinophilic inflammation.
Conclusion. Our results suggest that ADA1 and ADA2 isoenzymes may be valuable diagnostic tools in T2D and its complications. In particular, the potential of ADA2 for diagnosing and staging T2D, with different cutoff values being useful for identifying different patient subgroups. ADA2 may be a marker of early T2D and steatosis, and ADA1 may be a marker of hepatitis.
Keywords: adenosine deaminase 1 and 2, blood plasma, hepatic steatosis, hepatitis, type 2 diabetes.
For citation: Sargsyan E.Yu., Gishyan I.B., Darbinyan M.M., Sargisova Ye.G. Distribution of adenosine deaminase isoenzyme activities in patients with type 2 diabetes and liver complications. Clinical review for general practice. 2026; 7 (5): 70–78 (In Russ.). DOI: 10.47407/kr2026.7.5.00844
Распределение активности изоферментов аденозиндезаминазы у пациентов с сахарным диабетом 2-го типа и заболеваниями печени
Э.Ю. Саркисян1, И.Б. Гишян1, М.М. Дарбинян2, Е.Г. Саркисова11 Институт биохимии им. Г. Бунятяна НАН РА, Ереван, Армения;
2 Медицинский центр города Маралика, Маралик, Армения
lizasar2001@yahoo.com
Аннотация
Цель. Изучение потенциального значения изоферментов аденозиндезаминазы (ADA) в качестве диагностических маркеров при сахарном диабете 2-го типа (СД 2) и сопутствующих заболеваниях печени в популяции Армении. Целью также было установление пороговых значений активности изоферментов ADA у пациентов с СД 2 (с осложнениями со стороны печени и без них) и выявление корреляций с клиническими показателями крови.
Материалы и методы. В исследовании типа случай–контроль участвовали 175 пациентов и 105 здоровых лиц. Пациенты были сгруппированы по диагнозу и длительности заболевания (впервые выявленный СД 2, длительно текущий СД 2), а также по наличию осложнений со стороны печени (стеатоз или гепатит). Активность изоферментов ADA измерялась с использованием специфической колориметрической реакции. Статистический анализ применялся для сравнения активности изоферментов на разных стадиях заболевания, выявления корреляций с клиническими параметрами крови и определения оптимальных пороговых значений активности ADA2.
Результаты. Высокая активность ADA2 наблюдалась у пациентов с впервые выявленным СД 2 (21,3±2,99 Ед/л) и у пациентов с диабетом и стеатозом (23,46±2,73 Ед/л). В то же время активность ADA1 была особенно высокой у лиц с гепатитом (8,70±1,98 Ед/л) по сравнению с контрольной группой (3,19±0,20 Ед/л; p<0,001). Были установлены конкретные пороговые значения ADA2 для идентификации различных подгрупп пациентов. Обнаружена положительная корреляция между активностью ADA2 и процентным содержанием эозинофилов, что может свидетельствовать о связи с эозинофильным воспалением.
Заключение. Полученные результаты позволяют предположить, что изоферменты ADA1 и ADA2 могут представлять диагностическую ценность при СД 2 и его осложнениях. Особенно выделяется потенциал ADA2 для диагностики и стадирования СД 2, при этом различные пороговые значения могут использоваться для идентификации разных клинических подгрупп. ADA2 может служить маркером ранней стадии СД 2 и стеатоза, а ADA1 – маркером гепатита.
Ключевые слова: аденозиндезаминаза 1 и 2, плазма крови, стеатоз печени, гепатит, сахарный диабет 2-го типа.
Для цитирования: Саркисян Э.Ю., Гишян И.Б., Дарбинян М.М., Саркисова Е.Г. Распределение активности изоферментов аденозиндезаминазы у пациентов с сахарным диабетом 2-го типа и заболеваниями печени. Клинический разбор в общей медицине. 2026; 7 (5): 70–78. DOI: 10.47407/kr2026.7.5.00844
Introduction
Diabetes mellitus is a complex metabolic disease characterized by the dysregulation of glucose metabolism, resulting from either impaired insulin secretion (T1D) or decreased insulin sensitivity (T2D) [1, 2]. The majority of patients have T2D. Prolonged hyperglycemia is often accompanied by low-grade inflammation and immunological shifts involving both innate and adaptive immune cells, which can lead to damage in various organs and body systems [3, 4].
The liver is a major target organ for diabetic complications, second only to the pancreas. Nonalcoholic fatty liver disease (NAFLD), the most common liver disease globally, affects more than half of all individuals with T2D [5, 6].
Increasing evidence highlights the critical role of the adenosine system in regulating glucose homeostasis and in the pathophysiology of both T1D and T2D and their associated complications [7]. Adenosine, an endogenous purine nucleoside, modulates a wide range of physiological functions through various signaling pathways. It can influence many of the pathophysiological processes underlying T2D by affecting adipose tissue, skeletal muscle, and liver functions, as well as by regulating the immunological events that modulate insulin resistance [7, 8].
Intracellular adenosine levels are kept low by its phosphorylation to AMP via adenosine kinase and its deamination to inosine via adenosine deaminase (ADA; EC 3.5.4.4) [9].
In mammals, two genetically and functionally distinct ADA isoenzymes exist: ADA1 and ADA2. ADA1, encoded by a gene on chromosome 20q13.12, is a well-studied enzyme with high substrate affinity (Km ≈ 0.02 mM). It exists as a 35–41 kDa monomer or in a larger complex with ADA-binding protein (CD26/dipeptidyl peptidase IV). ADA2, encoded by the CECR1 gene on chromosome 22q11.21, is a less-characterized 110–120 kDa dimer with lower substrate affinity (Km ≈ 2.5 mM). Secreted primarily by monocytes and macrophages, ADA2 is a proposed biomarker for macrophage-driven inflammation. Both isoenzymes are widely expressed and serve as biomarkers for cell-mediated immunity in various immunological disorders [10–13].
However, extracellular adenosine levels in plasma can rise from nanomolar to micromolar concentrations at sites of inflammation, where energy demands increase and ADA-mediated deamination becomes a more dominant pathway [14].
In patients with T2D, a notable elevation in ADA activity has been observed in blood plasma compared to control groups. This activity has been shown to correlate with key markers of glycemic control, such as fasting blood glucose levels and glycated hemoglobin. Despite a significant number of studies on ADA in diabetes, its correlations with clinical blood parameters are highly complex and often contradictory. These inconsistencies depend on multiple factors, including specific study settings, patient demographics, and methodology [15, 16].
Our study presents novel data on ADA isoenzyme activity levels in T2D and its associated liver complications within the Armenian population of the highland region of Shirak (Armenia). The study was conducted in the Shirak highland region of Armenia (approximately 1500–2000 m above sea level). This region was specifically chosen because its population resides under moderate high-altitude conditions, providing an opportunity to explore how metabolic and genetic adaptations to altitude may influence biochemical and enzymatic markers, including adenosine deaminase isoenzymes.
We investigated the distribution of ADA isoenzyme activities in the plasma of patients with T2D, both with and without liver complications, and compared these findings to non-diabetic patients with liver disease and relatively healthy controls. We further examined how these activities vary based on the duration of diabetes and the stage of complications, and explored the correlations between ADA isoenzyme activities and various clinical blood parameters, including markers of inflammation and immune cell counts. We also considered the threshold values of ADA2 for different disease stages.
Materials and methods
Materials. Adenosine and erythro-9-(2-hydroxy-3-nonyl) adenine (EHNA) were obtained from Sigma-Aldrich (St. Louis, MO, USA). All other reagents were of analytical grade and high purity.
Participants. This study enrolled patients with T2D without complications, patients with T2D and concomitant hepatic disease (HD-T2D), patients with hepatic disease but without diabetes (HD), and relatively healthy individuals (Controls). All participants were recruited at the Maralik Medical Center between 2021 and 2024.
In total, 175 patients and 105 healthy individuals were included. Patients were divided into the following groups based on their diagnosis:
Group I: T2D without complications (n=100). This group was subdivided into: new-onset T2D (NO-T2D, n=20): patients newly diagnosed or treated for less than one year and long-term T2D (LT-T2D, n=80): patients treated for more than one year (average duration 3–10 years).
Group II: T2D with hepatic disease (HD-T2D, n=30). This group was subdivided into: Hepatic steatosis (HS-T2D, n=18) – the initial stage of NAFLD and Hepatitis (HP-T2D, n=12) – including chronic hepatitis.
Group III: Non-diabetic patients with hepatic disease (HD, n=45). This group included: Hepatic steatosis (HS, n=30) and Hepatitis (HP, n=15).
Group IV: Healthy controls (HC, n=105) matched for age and sex.
Exclusion criteria included diabetes with hypertension, renal or rheumatic diseases, hepatitis B or C infection, SARS-CoV-2 infection, and liver cirrhosis.
All patients had a confirmed clinical diagnosis according to the guidelines of the American Diabetes Association. Ethical approval for this study was obtained from the Independent Bioethics Committee for Scientific Research of Yerevan State Medical University after Mkhitar Heratsi, Yerevan, Republic of Armenia (ethical code: #N1-3/24). All participants provided written informed consent prior to enrolment.
Procedures. All clinical procedures were performed at the Maralik Medical Center. Participants were examined in the morning after an overnight fast, having abstained from caffeine, smoking, and strenuous exercise since the previous evening. Fasting venous blood samples were collected into tubes containing 3.2% sodium citrate as an anticoagulant. Plasma was prepared by centrifugation at 3400 × g for 10 min at room temperature, and the platelet-free plasma was immediately used for enzymatic assays.
Anthropometric and biochemical measurements. Routine biochemical parameters were determined in the clinical laboratory using standard methods: Fasting blood glucose (FBG) – glucose oxidase-peroxidase (GOD-POD) method; Total bilirubin (BIL) – diazosulfanilic acid (DSA) method; Cholesterol (CHOL) – colorimetric method; Urea (UREA) – urease method.
Complete blood count, liver function tests (ALT, AST, prothrombin time), and renal function tests (blood urea, plasma creatinine) were measured using an automated biochemical analyser (Hitachi 7600, Japan), according to the manufacturer’s instructions. Hepatic steatosis and hepatitis were assessed by instrumental methods (ultrasonography, FibroScan, etc.) and clinical/laboratory data (liver enzymes), following accepted clinical guidelines.
Determination of ADA Activity. Total adenosine deaminase (ADAt) activity in plasma was determined by measuring the ammonia produced during the enzymatic deamination of adenosine. The reaction mixture (0.5 mL) contained 0.04 M potassium phosphate buffer (pH 7.0), 6 mM adenosine, and 20 µL of the plasma sample. The mixture was incubated at 37°C for 40 minutes. The reaction was stopped by adding 1 mL each of phenol–nitroprusside and hypochlorite reagents [17]. Absorbance was measured at 630 nm against a blank containing all reagents except the substrate. Ammonia concentration was determined using ammonium sulfate as a standard. ADA activity was expressed in U/L (µmol NH₃ produced per liter of plasma per minute).
ADA2 activity was measured using the same procedure, with 0.04 mM EHNA (a selective ADA1 inhibitor) added to the reaction mixture. ADA1 activity was calculated by subtracting ADA2 activity from total ADA. All samples were analyzed in triplicate using Cary 60 spectrophotometer (Agilent, USA) and Spekol-211 (Carl Zeiss, Jena, Germany) instruments.
Statistical analysis. Data were analyzed using GraphPad Prism 8 (Version 8.0.2). Results are presented as mean ± standard error of the mean (S.E.M.). Group comparisons were performed using non-parametric tests, including the Mann–Whitney test for two-group comparisons and one-way ANOVA for multiple groups. Normality of data distribution was assessed using the Shapiro–Wilk test. When ANOVA results were significant, Tukey’s post-hoc test was applied.
Correlations between ADA isoenzyme activity and clinical parameters were assessed using Spearman’s (r) coefficients. Pearson coefficients were used only when data were normally distributed.
Receiver operating characteristic (ROC) curve analysis was performed to evaluate diagnostic sensitivity, specificity, and optimal cutoff values. A two-tailed p-value <0.05 was considered statistically significant.
Results
ADA activity in T2D patients. Our study demonstrated that the total activity of adenosine deaminase in the plasma of patients with T2D was significantly increased compared to the Controls (Fig. 1, a; p<0.0001). In patients with newly diagnosed T2D (NO-T2D), a marked elevation in ADA2 activity was observed (21.3±2.99 vs. 8.59±0.39 U/L), while ADA1 activity remained unchanged. In contrast, a slight increase in ADA1 activity was detected in patients with long-term T2D (LT-T2D). A similar pattern of ADA1 elevation was also noted in the HD-T2D group (Fig. 1, b).
The overall increase in total ADA activity was primarily attributed to the ADA2 isoenzyme, consistent with previous reports [14–16]. The highest ADA2 activity (23.46±2.73 vs. 8.59±0.39 U/L in Controls) was recorded in the HS-T2D subgroup (Fig. 1, c). The ADA1/ADA2 ratio varied depending on the stage of the disease (Fig. 1, d).
In the HD group, ADA1 isoenzyme activity was significantly higher (p<0.001) compared with HC, whereas ADA2 activity did not show a significant increase (Fig. 1, b, c). ADA2 activity tended to be slightly higher in HD-T2D patients than in those with T2D alone, although the difference did not reach statistical significance.
The figure clearly illustrates that ADA1 activity is notably elevated in hepatitis (both with and without diabetes), whereas ADA2 activity is markedly increased in diabetic patients — particularly in those with newly diagnosed diabetes and hepatic steatosis.
The clinical characteristics of all patient groups are summarized in Table 1.
A significant difference was observed between GLU, CHOL, CREA, HGB, ALT and ESR in patients with T2D compared to Controls. In HD-T2D patients, the difference in clinical characteristics was mainly comparable with the data of HD patients; the exception was CHOL, which increases in T2D and HD-T2D patients; RBC was lower compared to control only in HD-T2D patients (p=0.0074).
ADA isoenzyme correlations with clinical parameters. Table 2 presents correlations between the activity of ADA isoenzymes and a number of clinical parameters.
For comparison, correlations of ADA isoenzyme activities with clinical parameters were also performed for patients with liver diseases but without diabetes, and these are presented in Table 3.
We next determined correlations by quartiles of ADA isoenzyme activity, which allowed us to identify significant values of ADA activity in more detail, Table 4.
In the Controls, ADA1 positively correlates with ESR at the lowest ADA1 level, Q1 (<2.6 U/L); with increasing ADA1 (Q2), this correlation weakened. The positive ADA1-CHOL correlation, on the contrary, increases starting from the Q2 (>2.6 U/L). At the onset of the disease, in NO-T2D, a positive ADA1 with LYM correlation remained, which was no longer observed in LT-T2D. In HD in Q3 (>4.7 U/L) with an increase in ADA1, an ADA1 with WBC correlation was detected. An inverse correlation of ADA2 with LYM and a positive correlation with PMN (BF) was observed starting from Q3 (ADA2>10 U/L), therefore ADA2>10 U/L can be considered critical, at which immune protection becomes evident. In NO-T2D the ADA2 and GLU strong positive correlation was revealed, the most in Q4 (>30 U/L). In LT-T2D, the correlation between the highest ADA1 isoenzyme and GLU was observed in Q4 (ADA1>6.19), Table 4.
A ROC analysis was conducted on ADA2, given its more significant alterations in T2D and HD-T2D. The thresholds of ADA2 activity were determined, Fig. 2.
An optimal cutoff ADA2 activity values for different patient groups were calculated and presented in Table 5.
This table demonstrates the potential of ADA2 as a biomarker for diagnosing and staging T2D, with different cutoff values being useful for identifying different patient subgroups.
Discussion
Our study demonstrated that in T2D patients the total ADA activity was significantly elevated compared to HC. This increased activity was primarily due to the ADA2 isoenzyme, which is consistent with previous reports [15, 16]. However, in our patients, total ADA and isoenzyme activities were notably lower than most published values in both healthy controls and disease groups [16], although a comparable lower value has also been reported [19].
In patients with NO-T2D, the high level of ADA2 activity was observed, while ADA1 activity remained unchanged. In contrast, patients with LT-T2D and HD-T2D showed a moderate increase in ADA1 activity in addition to the elevated ADA2, Fig. 1, d.
In the comparison group of patients with HD, the activity of the ADA1 isoenzyme was significantly higher compared to control, particularly in HP group (8.70±1.98 vs 3.19±0.20 U/L, p<0.001), while no significant increase was found in ADA2 activity. However, a prevalence of ADA2 activity was found in the HS group, an earlier stage of the disease, compared to the HC (14.32±1.62 U/L vs 8.59±0.39 U/L, p<0.005), Table 3.
Correlations between ADA isoenzyme activity and various clinical blood parameters confirmed their involvement in homeostatic mechanisms [15, 16]. The most significant correlations were observed with CHOL, ESR, UREA, GLU, HGB, ALT, AST, AST/ALT ratio, BIL, LYM, BF, PMN, EOS, and NLR. Positive correlations were consistently noted with the isoenzyme that was dominant under specific conditions. In patients with NO-T2D, a strong positive correlation was found between ADA2 activity and GLU, particularly at higher ADA2 levels (Q4, >30 U/L). In contrast, in LT-T2D, ADA1 showed a positive correlation with glucose also in the highest quartile (Q4, >6.19 U/L), indicating a potential shift in the isoenzyme's role as the disease becomes chronic.
In HS-T2D patients, the positive correlation between ADA1 and glucose levels suggests that ADA1 may play a role in early-stage liver complications related to diabetes. This could be due to its involvement in the metabolic and inflammatory processes characteristic of these conditions. However, in patients with both T2D and hepatitis, these correlations were disrupted, likely due to the ongoing inflammation from the hepatitis complication. The acute inflammatory state of hepatitis can alter the activity of ADA isoenzymes and their relationship with other metabolic markers, overriding the more subtle, chronic correlations observed in HS-T2D. An increase in white blood cells, particularly an elevated neutrophil-to-lymphocyte ratio (NLR), is a key laboratory sign of inflammation [20]. Although the NLR values in this study were low, the highest was found in new-onset T2D patients (2.287±0.055), which is consistent with existing literature suggesting that elevated levels may indicate impaired glucose metabolism and serve as an additional marker for diabetes control [21].
Our results further support this, showing a positive correlation between ADA1 and lymphocytes, and between ADA2 and neutrophils across nearly all patient groups (Tables 2–4). This finding aligns with established mechanisms: human plasma ADA2 preferentially binds to neutrophils, while ADA1 binds to T and NK T cells that express CD26 receptors [20]. Because high levels of adenosine inhibit lymphocyte activation and proliferation [22], it was expected that increased ADA1 activity would positively correlate with the lymphocyte count, a finding that was confirmed in this study.
The observed increase in eosinophils is particularly interesting. In patients with hepatic disease with type 2 diabetes and diabetes alone, eosinophil levels were elevated, with the highest levels seen in newly diagnosed T2D patients (5.57% vs. 3.47% in controls, p=0.0135). In this group, we found a positive correlation between eosinophil count and ADA2 activity. In contrast, patients with long-term T2D showed only a small change in EOS levels, and an inverse correlation with ADA2. Similarly, in patients with T2D and steatosis, who also had high ADA2 activity, the association between ADA2 and EOS was positive, while ADA1 showed an inverse association with EOS. This finding suggests a complex, time-dependent relationship between ADA isoenzymes and eosinophils in T2D. The positive correlation in new-onset and steatosis-affected patients, alongside the inverse correlation in long-term T2D, highlights the dynamic role of these isoenzymes in different stages of the disease.
A study on the mechanism of ADA2's action on liver fibrosis in patients with NAFLD showed that monocytes infiltrating the liver produce high levels of ADA2, which then stimulates Kupffer cells to also express the enzyme. This positive association between serum ADA2 activity and liver fibrosis is believed to stem from a shift in macrophage polarization toward an anti-inflammatory, yet profibrotic, M2 phenotype [23, 24].
Interestingly, ADA2 deficiency (DADA2) has been shown to promote a pro-inflammatory macrophage differentiation in vitro. While the exact molecular mechanism of ADA2-induced M2 polarization and its impact on liver fibrosis is still being studied, it's clear that ADA2 plays a significant role in modulating immune cell behavior [10, 25].
Like ADA2, eosinophils also contribute to the resolution of inflammation. They secrete anti-inflammatory cytokines and are a major source of IL-4 in visceral adipose tissue, with their numbers inversely correlating with the degree of obesity. Eosinophils are also considered a factor in the polarization of monocytes into the anti-inflammatory M2 phenotype.
Although eosinophils and ADA2 are not part of the same biochemical pathway, they both function within the broader system of purinergic signaling to fine-tune immune responses. This shared role in promoting an M2 phenotype may explain the positive correlation observed between ADA2 and eosinophils in patients with diabetes and early-stage liver complications (HS-T2D), which exhibited the highest levels of ADA2.
Macrophage polarization is a key factor in inflammation and disease progression. An imbalance in their cytokine profiles can disrupt the delicate equilibrium of ADA isoenzymes [26].
Interestingly, in some late-stage tumors, a shift from the M2 to the M1 phenotype has been observed, a change accompanied by altered ADA isoenzyme activity. The ADA1/ADA2 ratio is therefore considered a valuable diagnostic tool, as it can indicate the severity and chronic nature of inflammation [27, 28]. This ratio reflects the complex interplay between different immune cell populations and their functional states.
The ADA1/ADA2 ratio varied significantly between patient subgroups, as shown in Fig. 1, c. For instance, in patients with both hepatitis and T2D, the ratio was significantly lower compared to those with hepatitis alone, despite an increase in ADA1 activity in both groups.
With uncontrolled inflammation, the conditions for a protective immune response are disrupted. In these cases, correlations between ADA isoenzymes and clinical parameters were attenuated or even undetectable. This suggests that the ADA1/ADA2 ratio may be a useful indicator of macrophage polarization and the overall inflammatory state.
The ROC analysis for plasma ADA2 in patients with hepatic disease and T2D, particularly in those with hepatic steatosis and T2D, showed a very high diagnostic value. The highest AUC (Area Under the Curve) value of 0.971 (95% CI: 0.938–1.000; p<0.0001) was observed in this subgroup, with a corresponding ADA2 activity threshold of 19.0 U/L. This high AUC indicates an excellent ability of ADA2 to distinguish between patients in this subgroup and healthy individuals.
Conclusion
We have conducted a comprehensive analysis of the activity of adenosine deaminase isoenzymes (ADA1 and ADA2) in various patient subgroups, which allows us to more accurately interpret their role.
This study suggests that ADA isoenzymes could be valuable diagnostic, prognostic, and therapeutic tools for type 2 diabetes and its liver complications.
ADA2 shows promise as a specific biomarker for the inflammatory component of T2D, particularly in its early stages. This is supported by its strong positive correlation with glucose and a high diagnostic value (a threshold of 19.0 U/L) for patients with T2D and hepatic steatosis. In contrast, ADA1 appears to be a better indicator of liver-related complications, correlating strongly with markers of liver damage and inflammation.
The distinct correlations of ADA1 with lymphocytes and ADA2 with neutrophils suggest that these isoenzymes play different roles in immune regulation. The study also proposes a link between ADA2 and eosinophils, suggesting they may collaboratively shift macrophage polarization toward an anti-inflammatory M2 phenotype. This sheds light on the complex interplay between metabolic disease, inflammation, and immune cell function.
The observed changes in ADA isoenzyme activity suggest that these molecules could be valuable therapeutic targets for managing T2D and its liver-related complications. Modulating the activity of these isoenzymes might influence inflammatory processes and improve patient outcomes.
Одобрение этического комитета. Диагноз «сахарный диабет 2-го типа» поставлен в соответствии с рекомендациями Американской ассоциации диабетологов. Все эксперименты, проведенные в ходе настоящего исследования, одобрены независимым комитетом по биоэтике Ереванского государственного медицинского университета им. Мхитара Гераци, Ереван, Республика Армения (протокол: #N1-3/24).
Ethical approval. Diagnosis of T2D was made according to the guidelines of the American Diabetes Association. All the experimental procedures in this study were approved by the Independent Bioethics Committee for Scientific Research of Yerevan State Medical University after Mkhitar Heratsi, Yerevan, Republic of Armenia, (ethical code: #N1-3/24).
Согласие на участие. Перед включением в исследование от всех участников получено письменное информированное согласие – в соответствии с принципами надлежащей клинической практики (GCP) и Хельсинкской декларации Всемирной медицинской ассоциации (принципами проведения медицинских исследований с участием человека).
Consent to participate. Written informed consent was obtained from all participants prior to their inclusion in the investigation, in accordance with Good Clinical Practice (GCP) standards and the WMA Declaration of Helsinki – Ethical Principles for Medical Research Involving Human Subjects.
Согласие на публикацию. Все авторы проверили результаты и одобрили финальную версию рукописи.
Competing interests. The authors declare that they have no competing interests.
Финансирование. Исследование выполнено без дополнительного финансирования.
Funding source. This research was not supported by any external funding.
Конфликт интересов. Авторы заявляют об отсутствии конфликта интересов.
Conflict of interests. The authors declare that there is no conflict of interests.
Список литературы доступен на сайте журнала https://klin-razbor.ru/
The list of references is available on the journal‘s website https://klin-razbor.ru/
Информация об авторах
Information about the authors
Elmira Yu. Sargsyan – Cand. Sci. (Biol.), Res. Officer, Buniatian Institute of Biochemistry of NAS RA. E-mail: el.sarkisyan@mail.ru; el.sarkisyan@yahoo.com
Саркисян Эльмира Юриковна – канд. биол. наук, науч. сотр. лаб. метаболизма адениловых соединений Института биохимии им. Г. Бунятяна НАН РА. E-mail: el.sarkisyan@mail.ru;
el.sarkisyan@yahoo.com
Inesa B. Gishyan – Assistant, Buniatian Institute of Biochemistry of NAS RA.
E-mail: inesagishyan@mail.ru; inesagishyan783@gmail.com
Гишян Инеса Багратовна – ассистент лаб. метаболизма адениловых соединений Института биохимии им. Г. Бунятяна НАН РА. E-mail: inesagishyan@mail.ru; inesagishyan783@gmail.com
Meri M. Darbinyan – doctor – laboratory assistant, Head of Laboratory of Clinical Biochemistry, Maralik Medical Center. E-mail: darbinyanmeri82@gmail.com
Дарбинян Мери Микаэловна – врач-лаборант, зав. лаб. клинической биохимии Медицинского центра Маралика. E-mail: darbinyanmeri82@gmail.com
Yelizaveta G. Sargisova – Cand. Sci. (Biol.), Senior Res. Officer, Buniatian Institute of Biochemistry of NAS RA. E-mail: lizasar2001@yahoo.com; ORCID: 0000-0002-1730-5340
Саркисова Елизавета Григорьевна – канд. биол. наук, ст. науч. сотр. лаб. метаболизма адениловых соединений Института биохимии им. Г. Бунятяна НАН РА. E-mail: lizasar2001@yahoo.com; ORCID: 0000-0002-1730-5340
Received: 10.10.2025
Revised: 30.10.2025
Accepted: 06.11.2025
Поступила в редакцию: 10.10.2025
Поступила после рецензирования: 30.10.2025
Принята к публикации: 06.11.2025
Список исп. литературыСкрыть список1. Petersmann A, Nauck M, Müller-Wieland D et al. Definition, classification and diagnosis of diabetes mellitus. Exp Clin Endocrinol Diabetes 2018;126(07):406-10. DOI: 10.1055/a-1018-9078
2. Zheng Y, Ley SH, Hu FB. Global aetiology and epidemiology of type 2 diabetes mellitus and its complications. Nat Rev Endocrinol 2018;14(2):88-98. DOI: 10.1038/nrendo.2017.151
3. Guarner V, Rubio-Ruiz ME. Low-Grade Systemic Inflammation Connects Aging, Metabolic Syndrome and Cardiovascular Disease (Mexico). Interdiscipl Top Gerontol 2015;(40):99-106. DOI: 10.1159/000364934
4. Xia C, Rao X, Zhong J. Role of T lymphocytes in type 2 diabetes and diabetes-associated inflammation. J Diabetes Res 2017;1:6494795. DOI: 10.1155/2017/6494795
5. Sawada K, Chung H, Softic S et al. The bidirectional immune crosstalk in metabolic dysfunction-associated steatotic liver disease. Cell Metab 2023;35(11):1852-71. DOI: 10.1016/j.cmet.2023.10.009
6. Antonioli L, Blandizzi C, Csóka B et al. Adenosine signalling in diabetes mellitus – pathophysiology and therapeutic considerations. Nat Rev Endocrinol 2015;11(4):228-41. DOI: 10.1038/nrendo.2015.10
7. Haskó G, Cronstein B. Regulation of inflammation by adenosine. Front Immunol 2013;(4):85. DOI: 10.3389/fimmu.2013.00085
8. Hu Q, Li G. Role of purinergic receptors in cardiac sympathetic nerve injury in diabetes mellitus. Neuropharmacology 2023;226:109406. DOI: 10.1016/j.neuropharm.2022.109406
9. Sauer A, Brigida I, Carriglio N et al. Autoimmune dysregulation and purine metabolism in adenosine deaminase deficiency. Front Immunol 2012;3:265. DOI: 10.3389/fimmu.2012.00265
10. Signa S, Bertoni A, Penco F et al. Adenosine deaminase 2 deficiency (DADA2): a crosstalk between innate and adaptive immunity. Front Immunol 2022;13:935-7. DOI: 10.3389/fimmu.2022.935957
11. Magni G, Riccio D, Ceruti S. Tackling chronic pain and inflammation through the purinergic system. Curr Med Chem 2018;25(32):3830-65. DOI: 10.2174/0929867324666170710110630
12. Lee PY, Schulert GS, Canna SW et al. Adenosine deaminase 2 as a biomarker of macrophage activation syndrome in systemic juvenile idiopathic arthritis. Ann Rheum Dis 2019;79(2):225-31. DOI: 10.1136/annrheumdis-2019-216030
13. Filiberti S, Russo M, Lonardi S et al. Self-renewal of macrophages: tumor-released factors and signaling pathways. Biomedicines 2022;10(11):2709. DOI: 10.3390/biomedicines10112709
14. Zhulai G, Oleinik E, Shibaev M et al. Adenosine-Metabolizing Enzymes, Adenosine Kinase and Adenosine Deaminase, in Cancer. Biomolecules 2022;12(3):418. DOI: 10.3390/biom12030418
15. Hoshino T, Yamada K, Masuoka K et al. Elevated adenosine deaminase activity in the serum of patients with diabetes mellitus. Diabetes Res Clin Pract 1994;25(2):97-102. DOI: 10.1016/0168-8227(94)90034-5
16. Larijani B, Heshmat R, Ebrahimi-Rad M et al. Diagnostic value of adenosine deaminase and its isoforms in type II diabetes mellitus. Enzyme Res 2016;(1):9526593. DOI: 10.1155/2016/9526593
17. Chaney AL, Marbach EP. Modified reagents for determination of urea and ammonia. Clin Chem 1962; 8:130-2. DOI: 10.1093/clinchem/8.2.130
18. Yadav S, Bansal M, Kumar P et al. Adenosine Deaminase as Inflammatory Marker in Type II Diabetes Mellitus. Int J Integr Health Sci 2023;11(1):7-11. DOI: 10.15850/ijihs.v11n1.2887
19. Xuan C, Tian QW, Zhang SY et al. Serum adenosine deaminase activity and coronary artery disease: a retrospective case-control study based on 9929 participants. Ther Adv Chronic Dis 2019 Dec 6;10:2040622319891539. DOI: 10.1177/2040622319891539
20. Kaljas Y, Liu C, Skaldin M et al. Human adenosine deaminases ADA1 and ADA2 bind to different subsets of immune cells. Cell Mol Life Sci 2017;74:555-70. DOI: 10.1007/s00018-016-2357-0
21. Buonacera A, Stancanelli B, Colaci M et al. Neutrophil to lymphocyte ratio: an emerging marker of the relationships between the immune system and diseases. Int J Mol Sci 2022;23(7):3636. DOI: 10.3390/ijms23073636
22. Saze Z, Schuler PJ, Hong CS et al. Adenosine production by human B cells and B cell–mediated suppression of activated T cells. Blood 2013;122(1):9-18. DOI: 10.1182/blood-2013-02-482406
23. Tiwari-Heckler S, Yee EU, Yalcin Y et al. Adenosine deaminase 2 produced by infiltrative monocytes promotes liver fibrosis in nonalcoholic fatty liver disease. Cell Rep 2021;37(4):109897. DOI: 10.1016/j.celrep.2021.109897
24. Jiang ZG, Sandhu B, Feldbr¸gge L et al. Serum activity of macrophage-derived adenosine deaminase 2 is associated with liver fibrosis in nonalcoholic fatty liver disease. Clin Gastroenterol Hepatol 2018;16(7):1170-2. DOI: 10.1016/j.cgh.2017.11.028
25. Lee PY, Aksentijevich I, Zhou Q. Mechanisms of vascular inflammation in deficiency of adenosine deaminase 2 (DADA2). Semin Immunopathol 2022;44:269-80. DOI: 10.1007/s00281-022-00918-8
26. Wen T, Rothenberg ME. The regulatory function of eosinophils. Microbiol Spectr 2016;4(5):10.1128/microbiolspec.MCHD-0020-2015. DOI: 10.1128/microbiolspec.MCHD-0020-2015
27. Kutryb-Zajac B, Harasim G, Jedrzejewska A et al. Macrophage-Derived Adenosine Deaminase 2 Correlates with M2 Macrophage Phenotype in Triple Negative Breast Cancer. Int J Mol Sci 2021;22:3764. DOI: 10.3390/ijms22073764
28. Wang L, Londono LM, Cowell J et al. Targeting adenosine with adenosine deaminase 2 to inhibit growth of solid tumors. Cancer Res 2021;81(12):3319-32. DOI: 10.1158/0008-5472.CAN-21-0340